Database

A dynamic customer journey visualisation tool and editor that makes sending messages easy.

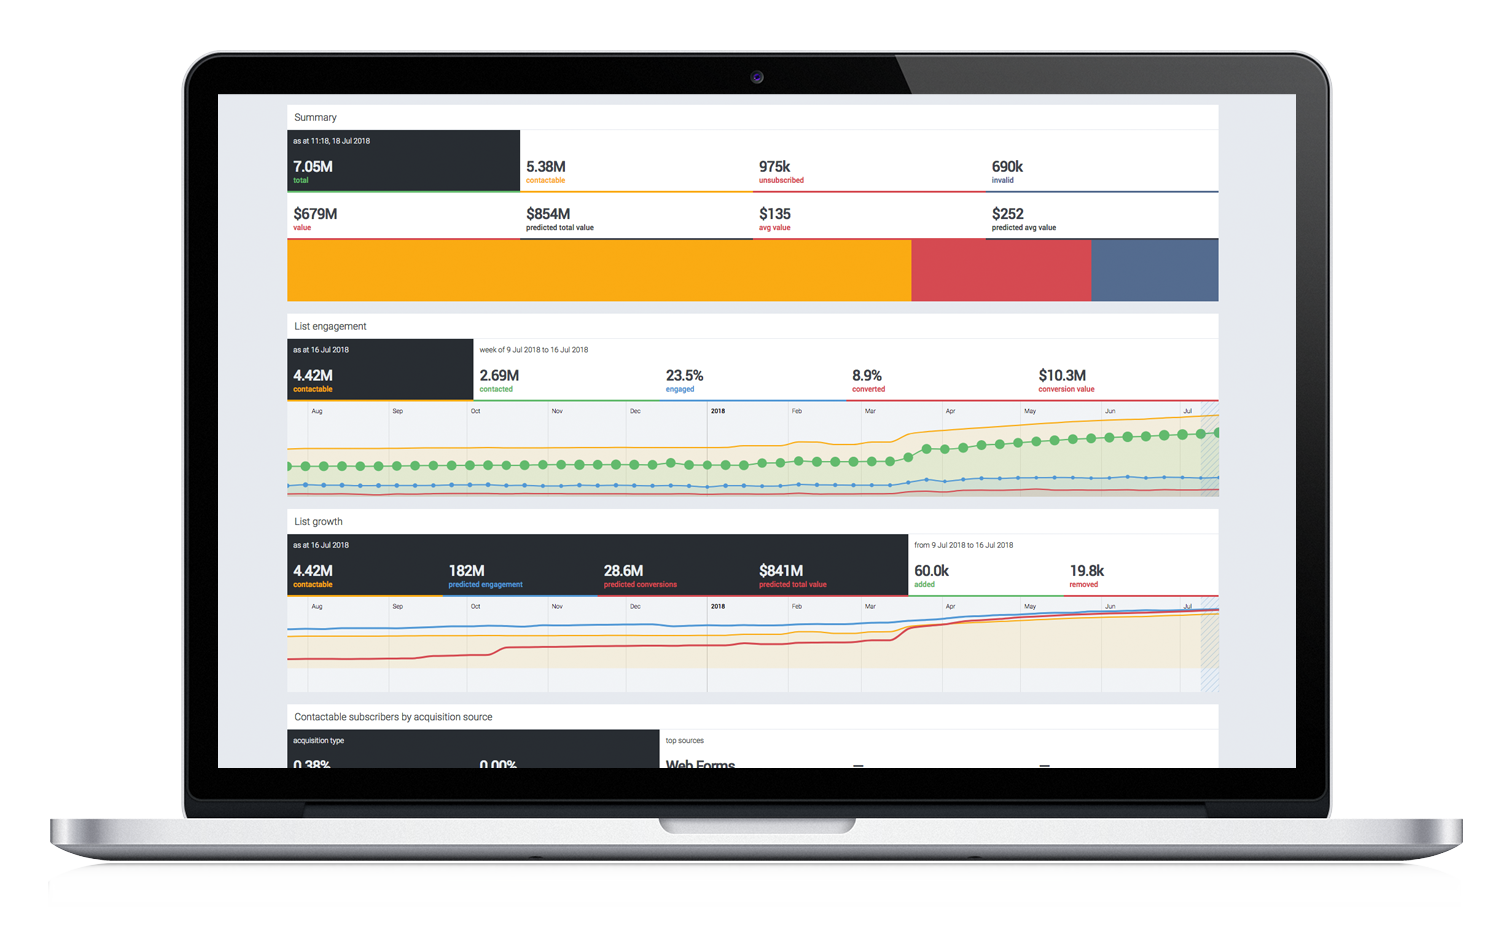
Subscriber list reports allow you to view a full history of customer activity across a wide range of criteria, and they allow you to compare overall database and list base performance via interactive dashboard reports.
Each list is a segment within the database. Examples of list segments can be:

  • Location – state
  • Subscriber personas
  • Content preferences
  • Frequency preferences

Subscriber list reports allow you to view a full history of customer activity across a wide range of criteria, and they allow you to compare overall database and list base performance via interactive dashboard reports.

List engagement is presented as an interactive graph that is displayed in an easy to read dashboard format, and allows you to drill down to view specific report metrics such as:

  • Contactable subscribers
  • Contacted subscribers (in a reporting period)
  • Engaged subscribers
  • Percentage of subscribers who have converted
  • Conversion value
  • Acquisition source and performance

You are also able to view the growth of your subscriber list over the entire history of the list from creation date (or from a start date you specify). Some of the metrics you can view in terms of list growth include:

  • Predicted engagement
  • Predicted conversions
  • Predicted total value
  • Number of subscribers added
  • Number of subscribers removed

A valuable database report is the acquisition source report, which provides a detailed overview of the acquisition sources of the subscriber list and which sources contribute the most to subscriber list growth.

Decile performance reporting is also available, which displays the performance of the subscriber list and compares the best and worst percentile

Find out what makes Taguchi simply powerful by scheduling a free demo.

* By submitting this form, you are confirming you have read and agree to our Privacy Policy.